USD to INR Exchange Rate Comprehensive Guide
The complete guide to USD to INR: Fed/RBI policy, oil, reserves & remittances — and what actually moves the Dollar-Rupee rate.
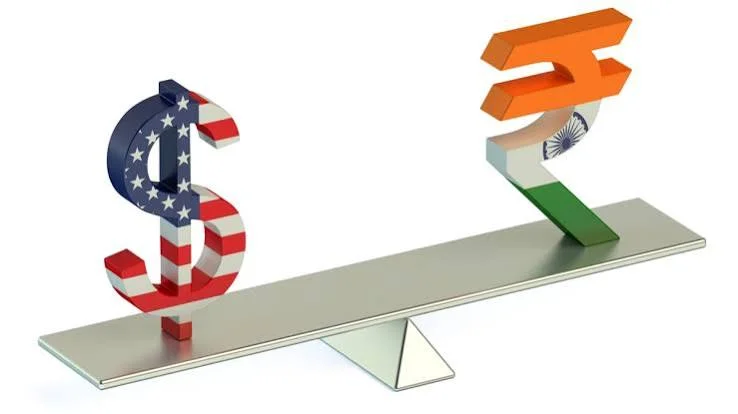
USD to INR Exchange Rate Today: Factors Influencing US Dollar vs Indian Rupee, Historical Trends, and Future Forecast
Published by Financial Markets Insights | Category: Foreign Exchange & Global Economy | Updated for 2026
―――――――――――――――――――――――――――――――――――――――――――――――――――――――
📌 EXECUTIVE SUMMARY: The USD to INR exchange rate is one of the most actively traded currency pairs in emerging markets. Understanding the mechanics behind US Dollar strength and Indian Rupee movements requires analyzing macroeconomic indicators, interest rate differentials, crude oil dynamics, trade balances, and central bank intervention strategies. |
1. Introduction: Understanding the USD to INR Exchange Rate
The currency exchange rate between the United States Dollar (USD) and the Indian Rupee (INR) is far more than a simple financial ticker. It serves as a vital barometer for global macroeconomic health, India's international trade competitiveness, and the purchasing power of over 1.4 billion people. Whether you are an Indian student preparing for overseas education, an IT services exporter, an NRI remitting funds back home, or a global investment manager, the fluctuation in the USD/INR currency pair directly affects your bottom line.
In recent years, the USD to INR exchange rate has witnessed historic shifts. From trading around 60 INR per USD a decade ago to breaching levels near 85–87 INR per USD in 2025–2026, the movement reflects structural differences between an advanced reserve-currency economy and a rapidly growing emerging market.
2. Historical Overview: The Evolution of the Indian Rupee Against the US Dollar
To comprehend where the USD/INR exchange rate is heading, one must examine its historical trajectory. At the time of India's independence in 1947, the Rupee was pegged to the British Pound at parity with the US Dollar (1 USD ≈ 1 INR). Over the subsequent decades, economic crises, trade imbalances, structural devaluation policies, and global shifts transformed the currency landscape.
Key Milestones: Key historical milestones include:
1966 Devaluation: Triggered by severe drought and conflict, the Rupee was devaluated from ₹4.76 to ₹7.50 per USD.
1991 Balance of Payment Crisis: India faced acute foreign reserve depletion, leading to a two-step devaluation of ~19% and the opening of the economy toward market-determined exchange rates.
2008 Global Financial Crisis: Capital flight from emerging markets pushed USD/INR from ₹40 to ₹50+ levels.
2013 Taper Tantrum: US Fed quantitative easing taper talk caused massive rupee weakness, sending the pair to ₹68.8.
2020–2026 Post-Pandemic & Inflation Era: Aggressive US Federal Reserve rate hikes, geopolitical tensions, and high energy prices propelled the Dollar above ₹85.
Figure 1: 10-Year Historical Exchange Rate Trajectory for USD to INR (2014 – 2026)
3. Core Factors Influencing the Strength of the US Dollar (USD)
The United States Dollar is the world's primary reserve currency, involved in nearly 88% of all foreign exchange transactions globally. Understanding the USD side of the currency pair involves analyzing several macro drivers:
1. Federal Reserve Monetary Policy & US Interest Rates: When the Federal Reserve raises benchmark interest rates to combat inflation, yields on US Treasury bonds rise. Global institutional investors shift capital into USD-denominated assets seeking higher risk-adjusted returns, driving up the dollar's value globally.
2. Global Risk Aversion & 'Safe-Haven' Capital Flows: During times of global geopolitical conflict, financial crises, or economic instability, investors flock to US Dollar assets as a 'safe haven.' This safe-haven demand causes the Dollar Index (DXY) to rally sharply against almost all emerging market currencies.
3. US Economic Data & Labor Market Strength: Strong US GDP growth, robust non-farm payroll reports, and solid consumer spending reinforce investor confidence in US markets, strengthening the greenback relative to foreign currencies.
4. Core Factors Influencing the Value of the Indian Rupee (INR)
While the US Dollar reflects global risk sentiment, the Indian Rupee's domestic valuation depends heavily on India's macroeconomic balance sheet and external sector vulnerability:
1. Crude Oil Prices & India's Import Dependency: India imports over 80–85% of its crude oil requirements. When global Brent crude prices rise, India's oil import bill expands significantly. Importers must purchase more US Dollars to pay for crude imports, placing direct selling pressure on the Rupee.
2. Foreign Institutional Investment (FII/FPI) Flows: Foreign Institutional Investors (FIIs) and Foreign Portfolio Investors (FPIs) inject or withdraw billions from Indian equities and debt markets. Net capital inflows boost the Rupee, while net outflows lead to currency depreciation.
3. Trade Balance & Current Account Deficit (CAD): India runs a structural merchandise trade deficit because imports exceed exports. A widening Current Account Deficit (CAD) means greater foreign exchange outflow than inflow, creating fundamental downward pressure on INR.
4. Inflation Differential (CPI Inflation): If domestic inflation in India is consistently higher than inflation in the US, the purchasing power of the Rupee erodes faster than the Dollar, causing long-term structural depreciation according to Purchasing Power Parity (PPP) principles.
Figure 2: Relative Weight Breakdown of Key Factors Influencing the USD to INR Exchange Rate
5. The Interplay: Key Macroeconomic Drivers Explained
The exchange rate is ultimately determined by the interplay between USD supply and demand in the forex market. Let's delve into the specific mechanics of these major macroeconomic drivers:
A. Interest Rate Differential (US Fed vs RBI)
The gap between the Reserve Bank of India's (RBI) Repo Rate and the US Federal Reserve's Federal Funds Rate is one of the most critical determinants of short-term capital flows. When the yield differential narrows (i.e., Fed rates rise relative to RBI rates), carry-trade profitability decreases, causing capital to exit emerging markets like India and flow back to US Dollar treasuries.
Figure 3: Historical and Projected Benchmark Policy Rates: US Federal Reserve vs RBI (2020 – 2026)
B. Crude Oil Sensitivity & Import Costs
Every $10 per barrel increase in Brent Crude oil prices typically widens India's Current Account Deficit by approximately $14–15 billion and adds around 0.4–0.5% upward pressure on USD/INR. The chart below illustrates the relationship between rising crude oil prices and expected depreciation pressure on the Rupee.
Figure 4: Brent Crude Oil Price ($/barrel) vs Estimated Depreciation Pressure on Indian Rupee
6. Role of Central Banks: RBI Foreign Reserve Interventions
Unlike currencies with purely free-floating exchange rate regimes, the Indian Rupee operates under a managed float regime. The Reserve Bank of India actively intervenes in the spot and forward currency markets to curb excessive volatility and prevent panic-driven depreciation.
Intervention Tactics: How RBI Manages USD/INR Volatility:
Selling USD from Reserves: When the Rupee experiences severe downward pressure, RBI sells US Dollars from its forex reserves (~$600B+) to absorb excess INR supply.
Forward Market Swaps: RBI uses buy/sell forex swaps to manage system liquidity without draining physical spot reserves.
NRI Deposit Schemes: During severe stress, RBI offers attractive foreign currency non-resident (FCNR) deposit rates to attract dollar inflows.
Summary Matrix: Economic Drivers & Impact on USD/INR
Economic Driver | Market Condition / Scenario | Impact on USD/INR Pair |
US Fed Interest Rates | Fed Hikes Rates Relative to RBI | USD Strengthens / USD-INR Rises ↑ |
Crude Oil Prices | Brent Crude Surges Above $90/bbl | INR Weakens / USD-INR Rises ↑ |
FII Stock Investments | Strong Equity Inflows into India | INR Strengthens / USD-INR Falls ↓ |
India Trade Deficit | Import Bill Exceeds Export Revenues | INR Weakens / USD-INR Rises ↑ |
RBI Reserve Intervention | RBI Sells Spot Dollars in Market | Rupee Stabilizes / Caps USD-INR Gain |
7. Impact of USD/INR Movements on Key Stakeholders
Currency fluctuations do not affect everyone equally. Shifts in the USD to INR exchange rate create winners and losers across various economic sectors:
1. Overseas Students & Families: A stronger USD increases tuition fees and living expenses when calculated in Rupees, requiring higher education loan amounts.
2. Indian IT & Services Exporters: Indian IT companies (Infosys, TCS, Wipro) earn revenue in USD and incur costs in INR. A 1% depreciation in the Rupee typically improves operating margins by 30–50 basis points.
3. Non-Resident Indians (NRIs): Non-Resident Indians sending money to families in India get more Rupees per Dollar sent, boosting domestic remittance inflows.
4. Importers & Domestic Consumers: Manufacturing, electronics, and energy companies face higher raw material import costs, squeezing margins or passing price hikes to consumers.
5. Foreign Portfolio Investors: Foreign investors evaluating Indian stocks face currency translation loss if Rupee depreciation exceeds equity returns.
8. Hedging Currency Risk & Practical Strategies
Businesses and individuals exposed to foreign exchange fluctuations can utilize several tools to mitigate currency risk:
Forward Contracts: Exporters and importers lock in a guaranteed USD/INR rate for a future transaction date.
Currency Futures & Options: Traded on exchanges (NSE, BSE), allowing market participants to hedge exposure with standardized contracts.
Staggered Remittances: NRIs and students can convert funds in batches using Dollar Cost Averaging (DCA) to smooth out volatility spikes.
9. Future Outlook & Conclusion
Looking ahead through 2026 and beyond, the USD to INR currency pair will continue to be governed by the interplay of US interest rate normalization, India's robust domestic economic growth (~6.5-7.0% GDP growth), and global energy dynamics.
While structural inflation differentials suggest a long-term gradual bias toward Rupee depreciation (historically 2-3% annualized), India's record foreign reserves, inclusion in global bond indices (JPMorgan GBI-EM), and growing services export surplus provide a strong buffer against chaotic currency shocks.
📌 FINAL SUMMARY: Navigating foreign exchange rates requires constant monitoring of key macro triggers: US Federal Reserve FOMC decisions, RBI monetary policy announcements, monthly US/India CPI inflation data, crude oil prices, and net FII flow statistics. |
Try it yourself
Ready to convert? Use our live Usd To Inr converter and rate alert tool — free, no sign-up required.