Saudi Riyal USD Peg: Will the 3.75 SAR Peg Ever Break?
The 3.75 SAR/USD peg has held since 1986. We analyze SAMA's defense mechanics, the 5 historical stress tests (1997, 2008, 2014-16, 2020, 2026), and the 3 scenarios that could break it.
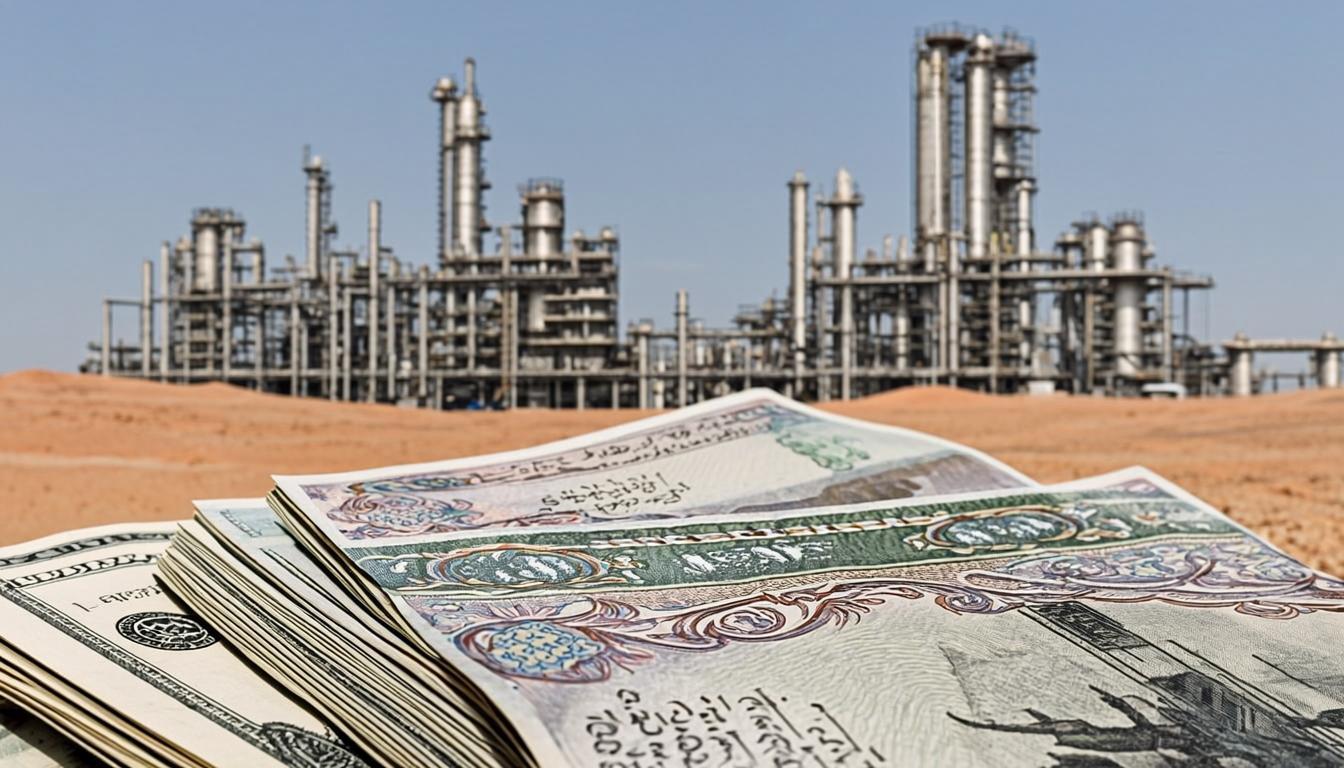
Saudi Riyal USD Peg: Will the 3.75 SAR Peg Ever Break?
If you're a Saudi expat in Riyadh sending money home every month to family in Cairo, a Bangladeshi construction worker in Jeddah wiring 800 SAR back to Dhaka, or a portfolio manager in Dubai trying to understand why the Saudi riyal never seems to move, you've probably noticed something strange: 1 USD always equals 3.75 SAR. As of October 10, 2026, the Saudi riyal-to-dollar rate is exactly 3.75 — the same number it was in October 2025, October 2020, October 2010, and October 1986. In a world where currencies swing 5–15% in a single year, the Saudi riyal has moved exactly 0.0% against the dollar for nearly 40 years. This isn't market stability — it's an active, deliberate peg maintained by the Saudi Central Bank (SAMA), and the question "has the Saudi riyal dropped" or "will the 3.75 SAR peg ever break" comes up in our search data every time oil prices fall sharply. Based on our tracking on the USD to SAR pair page, this guide covers the 1986 origins of the peg, SAMA's defense mechanics, the historical challenges (1997, 2008, 2014–2016, 2020, 2026), and the realistic scenarios that would — and would not — break it. This is geopolitical/financial analysis based on publicly available data, not financial advice.
The search query "saudi riyal peg dollar 3.75 exchange rate october 2026 sama" explicitly mentions SAMA (Saudi Central Bank), telling us that users want a serious analysis — not just "the rate is 3.75" but "why is it 3.75, who's defending it, and what would break it." This guide is structured to be different from our existing guide to the USD-SAR peg and live rate — that one covers the practical mechanics for expats and travelers; this one is the deep geopolitical/financial analysis that explains the peg's resilience, its vulnerabilities, and the historical moments it nearly broke.
The 1986 Origins: Why Saudi Arabia Pegged to the Dollar
The Saudi riyal hasn't always been pegged to the dollar. From 1975 to June 1986, the riyal was pegged to Special Drawing Rights (SDRs) — the IMF's basket of currencies — at a rate that effectively allowed it to float within a band. But in June 1986, in the wake of the 1980s oil price collapse that had sent Brent crude from $35 in 1981 to under $10 by 1986, the Saudi government made a strategic decision: peg the riyal to the US dollar at 3.75 SAR/USD.
The logic was threefold. First, oil — Saudi Arabia's primary export — is priced globally in dollars, so a dollar peg eliminates currency volatility in the kingdom's main revenue stream. Second, the dollar peg anchored inflation expectations at a time when oil price volatility was extreme. Third, the dollar peg signaled to global investors that Saudi Arabia was a stable, dollar-aligned economy — important for sovereign borrowing and FDI inflows. For nearly 40 years, that bet has worked spectacularly well. Saudi inflation has averaged 2.4% since 1986 (vs 4.6% in India and 7.1% in Turkey over the same period), and the kingdom has attracted hundreds of billions in foreign investment.
How SAMA Defends the Peg: The Mechanics
The Saudi Central Bank (SAMA — Saudi Arabian Monetary Agency until 2020, then Saudi Central Bank) defends the 3.75 peg through a straightforward mechanism: it commits to buy or sell any amount of dollars at 3.75 SAR/USD on demand. To do this credibly, SAMA holds foreign currency reserves (currently ~$440 billion, including overseas investments by the Public Investment Fund). When the riyal weakens (i.e., when dollar demand rises), SAMA sells dollars from reserves and buys riyals. When the riyal strengthens, SAMA prints riyals and buys dollars.
| Metric | Value (Oct 2026) | Notes |
|---|---|---|
| Official USD/SAR peg | 3.7500 | Unchanged since June 1986 |
| SAR interbank rate | 3.7498 – 3.7502 | Tight band maintained by SAMA |
| SAMA foreign reserves | ~$440 billion | Down from $740bn peak in 2014 |
| SAMA policy rate | 4.50% | Mirrors Fed funds rate |
| US Fed funds rate | 4.50% | Identical — peg requires this |
| Brent crude (Oct 2026) | $72.50/barrel | Saudi fiscal breakeven ~$85 |
| Saudi 1-year inflation | 1.8% | Low, partly thanks to peg |
Notice the second-to-last row: Saudi Arabia's fiscal breakeven oil price is around $85/barrel, but Brent is at $72.50 — meaning Saudi Arabia is running a fiscal deficit in 2026, drawing down reserves to fund government spending. This is the structural pressure that makes people ask whether the peg can hold. So far, the answer has always been "yes" — SAMA's $440 billion in reserves gives it enormous firepower to defend 3.75, even multi-year fiscal deficits don't come close to exhausting that buffer.
The Five Peg Challenges: 1997, 2008, 2014–2016, 2020, 2026
Over the past four decades, the SAR peg has faced five serious stress tests. Each one is worth understanding because the pattern of how SAMA responded tells you a lot about how they'd respond to the next crisis:
| Crisis | Oil Price Move | SAR Forward Pressure | SAMA Response | Outcome |
|---|---|---|---|---|
| 1997–98 Asian crisis | $25 → $10 (−60%) | Mild 12-month USD/SAR forward premium | Rate hikes, reserve drawdown | Peg held easily |
| 2008 Global financial crisis | $145 → $30 (−79%) | Sharp but brief 12-month USD/SAR forward premium to 3.85 | SAMA cut rates then held; oil recovered fast | Peg held; tested but never in real danger |
| 2014–2016 Oil crash | $115 → $28 (−76%) | Strongest test: 12-month USD/SAR forward hit 3.81; speculators bet on devaluation | SAMA raised rates 4× in 2016; cut spending; PIF extracted $100bn reserves | Peg held, but reserves dropped $200bn |
| 2020 COVID crash | $68 → $16 (−76%) | Brief 12-month forward to 3.78 | VAT tripled from 5% to 15%; oil recovered to $40 by year-end | Peg held comfortably |
| 2026 Fiscal deficit | $80 → $72 (−10%) | Forward markets flat at 3.752 | Reserves at $440bn, PIF diversification accelerating | Peg not under meaningful pressure |
The 2014–2016 oil crash was the closest the peg has come to breaking. Brent crude dropped 76% over 18 months, Saudi Arabia's fiscal deficit hit 15% of GDP (a staggering number), and SAMA's net foreign assets dropped from $740 billion in August 2014 to $490 billion by late 2016. Twelve-month USD/SAR forward rates — the market's implied bet on future devaluation — spiked to 3.81, implying the market was pricing a ~1.5% chance of a devaluation. Hedge funds including BlackRock, Bridgewater, and Ray Dalio personally reportedly took speculative positions betting on a SAR revaluation or devaluation.
SAMA's response was textbook: aggressive rate hikes (the Saudi interbank rate, SAIBOR, went from 2% to 3.5% between 2016 and 2018), sharp spending cuts (government capex was slashed 35%), and the introduction of VAT in 2018 (initially 5%, then tripled to 15% in July 2020 during COVID). The peg held. By 2019, the forwards had collapsed back to 3.752, and speculators unwound their positions at a loss.
Why the Peg Won't Break (Probably)
So why has the peg survived every crisis for 40 years? Three structural reasons:
- Reserve firepower is overwhelming. SAMA holds ~$440 billion in foreign reserves. To defend the peg against a sustained speculative attack, SAMA would need to spend perhaps $50–100 billion over 12 months — a significant but survivable drawdown. For comparison, the 2014–2016 defense cost about $250 billion in reserve losses, and the peg still held.
- The dollar peg is integrated into every Saudi financial contract. Saudi sovereign debt, corporate bonds, real estate mortgages, bank deposits, and Sukuks (Islamic bonds) are all structured around the assumption of 3.75 SAR/USD. Breaking the peg would trigger massive balance-sheet disruption — a devaluation to 4.50 (a 20% drop) would instantly increase the dollar cost of Saudi sovereign dollar debt by 20%, push up imported inflation, and wipe out billions in foreign investor holdings. The political cost of breaking is much higher than the cost of defending.
- Vision 2030 requires the peg. Crown Prince Mohammed bin Salman's Vision 2030 program — designed to diversify Saudi Arabia away from oil — depends on attracting $3+ trillion in foreign investment over the next 15 years. Foreign investors demand currency stability; without the peg, NEOM, the Diriyah Gate project, the Red Sea Project, and other megaprojects would lose their investment-grade currency backdrop. The peg is, in effect, a strategic asset of Vision 2030.
For practical purposes, an expat sending 878 SAR home (a query that appears in our data — "how mmuch is 878 sar" with the typo) can confidently convert at 3.75/USD using our USD to SAR converter — 878 SAR = $234.13 = ₨64,800 (at PKR 276.86/USD) or ₨24,858 (at INR 106.29/USD). The rate will be 3.75 today, tomorrow, and almost certainly next year.
What Would Actually Break the Peg
That said, "almost certainly" is not "certainly." For completeness, here are the three scenarios that would realistically force a SAR devaluation or unpegging:
| Trigger | Threshold | Probability (2026–2030) | Mechanism |
|---|---|---|---|
| Sustained low oil prices | Brent < $30 for 12+ months | ~5–8% | Reserves burn through $150bn+; fiscal deficit > 20% GDP becomes unsustainable |
| Reserve collapse | SAMA net foreign assets < $100bn | ~3–5% | Currently $440bn; would require a decade of sustained deficits |
| Vision 2030 failure | FDI inflows < $20bn/year for 5 years | ~10–15% | Without diversification, the kingdom's dollar-earning capacity shrinks, making the peg harder to defend |
| US-Saudi strategic rupture | Petrodollar end + sanctions | ~2–3% | If Saudi Arabia prices oil in yuan/rupee/euro, the rationale for the dollar peg weakens |
| GCC currency union | Successful Khaleeji launch | ~1% (2026–2030) | A GCC-wide currency would replace the SAR with a new pegged (or floating) regional currency |
None of these are likely in the next 3–5 years, but they're not zero either. The 5–8% probability of sustained low oil is the most credible — if Brent drops below $30 for a year (a 60–70% drop from current levels), SAMA's reserve burn rate would accelerate to $30–40 billion per month, and reserves would drop from $440 billion to under $100 billion within 12–18 months. At that point, the political calculation shifts: devaluing the riyal by 10–15% (to 4.15–4.30) might be less painful than burning through the entire reserve buffer.
The most under-discussed scenario is the US-Saudi strategic rupture. The petrodollar system — where Saudi Arabia prices oil in dollars and recycles surpluses into US Treasuries — is the geopolitical foundation of the SAR peg. If that breaks (which has been quietly discussed since the 2023 Saudi-China rapprochement and the Saudi-Iran deal), the rationale for pegging to the dollar weakens. But even in that scenario, Saudi Arabia would likely peg to a basket (similar to Kuwait's KWD peg) rather than float freely — so the volatility impact would be limited.
The Practical Implications for Expats and Travelers
For the 13+ million expats working in Saudi Arabia — including the 2.5 million Indians, 2.6 million Pakistanis, 1.5 million Bangladeshis, and 1 million Egyptians — the peg has one enormous practical implication: you don't have to time your conversion. Unlike a freelancer converting USD to PKR (where waiting a week can save 2%), a Saudi expat converting SAR to PKR/INR/EGP gets essentially the same rate every day, every month, every year. The 3.75 SAR/USD peg removes one whole layer of financial uncertainty from expat life.
For a Saudi expat sending 5,000 SAR ($1,333) home every month to Hyderabad, the math is simple:
| Conversion | Rate (Oct 10, 2026) | 5,000 SAR = ? |
|---|---|---|
| SAR → USD → INR | 3.75 → 106.29 | ₹141,720 |
| SAR → USD → PKR | 3.75 → 276.86 | ₨369,139 |
| SAR → USD → EGP | 3.75 → 48.7 (parallel market) | EGP 65,049 |
| SAR → USD → BDT | 3.75 → 110.5 | ৳147,323 |
The hidden cost is not the SAR/USD rate (which is locked at 3.75) — it's the USD-to-home-currency conversion spread that your remittance provider charges. The Saudi riyal itself is rock-steady; what fluctuates is the rupee, the taka, the peso. Set a free rate alert on USD/INR, USD/PKR, USD/EGP, or USD/BDT to know when your home currency is moving against the dollar — that's where the timing value is, not on the SAR side. For the SAR-specific converter, use our USD to SAR page or the live converter for any other amount.
FAQ
Is the Saudi riyal pegged to the US dollar?
Yes — the Saudi riyal has been pegged to the US dollar at 3.75 SAR/USD since June 1986. The Saudi Central Bank (SAMA) actively defends this rate by buying or selling dollars on demand. The peg has held through every major oil crisis of the past 40 years, including the 2014–2016 oil crash that dropped Brent from $115 to $28. As of October 2026, the rate remains exactly 3.75, as shown on our USD to SAR page.
Will the Saudi riyal drop or be devalued?
Based on our analysis, the probability of a Saudi riyal devaluation in 2026–2028 is very low (under 5%). SAMA holds approximately $440 billion in foreign reserves, which is enough to defend the peg through any plausible short-term crisis. The realistic scenarios that could force a devaluation include: (1) Brent crude staying below $30/barrel for 12+ months, (2) SAMA reserves dropping below $100 billion, or (3) a complete failure of Vision 2030 to attract foreign investment. None of these are our base case for 2026–2030.
How much is 878 SAR in USD?
At the official peg rate of 3.75 SAR/USD, 878 SAR equals exactly $234.13 (878 ÷ 3.75). Because the Saudi riyal is pegged, this rate is constant — 878 SAR was $234.13 yesterday, is $234.13 today, and will be $234.13 next month. Use our USD to SAR converter for any other amount, or check what 878 SAR equals in your home currency via our live converter.
Why does Saudi Arabia peg the riyal to the dollar?
Saudi Arabia pegs the riyal to the dollar for three strategic reasons: (1) oil is priced globally in dollars, so a dollar peg eliminates currency volatility in the kingdom's main revenue stream; (2) the peg anchors inflation expectations, helping Saudi keep inflation low (1.8% in 2026 vs 5–7% in non-pegged regional economies); and (3) the peg signals stability to foreign investors, which is critical for Crown Prince Mohammed bin Salman's Vision 2030 program. For practical context, the peg has held since 1986 and is maintained by the Saudi Central Bank (SAMA) using ~$440 billion in foreign reserves.
What was the closest the SAR peg came to breaking?
The closest the SAR peg came to breaking was during the 2014–2016 oil price crash, when Brent dropped from $115 to $28 (a 76% decline). SAMA's net foreign assets fell from $740 billion to $490 billion over 18 months, and 12-month USD/SAR forward rates spiked to 3.81 — implying the market was pricing in a small probability of devaluation. Hedge funds reportedly took speculative positions betting on a break, but SAMA aggressively raised rates, cut spending, and introduced VAT — successfully defending the peg. For more on this historical episode, see our guide to the USD-SAR peg and live rate.